Old Navy reported more traffic to its online kids’ assortment after its MrBeast back-to-school campaign, but those figures do not establish a sales lift. The original 11 September 2026 report by Peter Adams cites data supplied by the company and comments from Gap Inc. marketing executive Damon Berger.
Sources checked on 10 November 2026. This is a retrospective of the campaign’s reported early results, not a current offer or an independently audited attribution study.
Old Navy × MrBeast: reported results
| Metric | Reported result and period | What it does not establish |
|---|---|---|
| Traffic to the online kids’ assortment | More than 22% growth in the days immediately after launch | The report does not provide the underlying comparison dataset or a causal control group |
| Global video views | More than 100 million, as reported on 11 September | Unique customers, orders or profitable purchases |
| YouTube impressions | 1.4 billion, as reported on 11 September | Unique reach or completed video views |
These figures come from the same original report. They describe different stages of exposure and response and should not be added together. The campaign was presented as the first activation in a multiyear partnership.
What the campaign connected
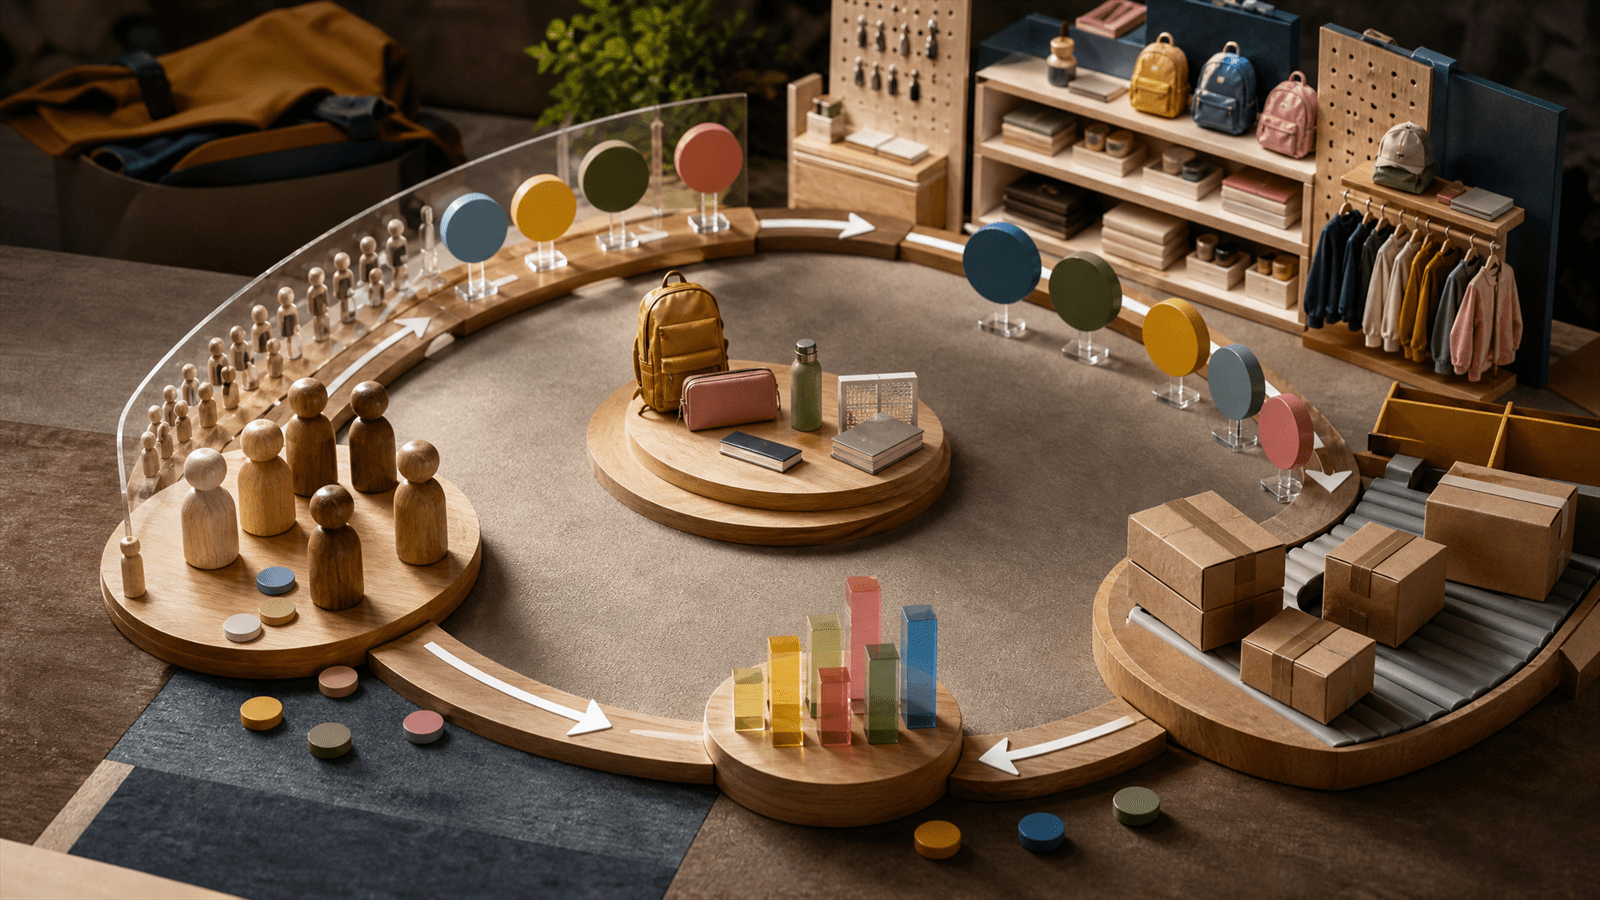
Our assessment: the useful unit of analysis is the path from creator content to a relevant shopping destination. A campaign can attract attention without helping a visitor decide what to buy. A retailer evaluating this approach should inspect both the message that generated the visit and the product experience that followed it.
That means checking stock, size availability, delivery information and the offer before expanding media support. Otherwise a traffic spike can conceal a weak shopping experience. The reported traffic result is a reason to examine the next step, not a substitute for measuring it.
A measurement plan for a smaller retailer
- Define the baseline. Record the comparison period, seasonal context and other promotions before launch.
- Track the destination. Separate product-page visits from checkout starts and completed orders.
- Measure commercial quality. Include margin, returns and new-customer contribution rather than reporting revenue alone.
- Test attribution. Use an appropriate comparison design where feasible; label observational results as observational.
- Plan follow-through. Decide what useful product information or follow-up a visitor needs after the initial creative.
These are editorial recommendations for evaluation. They are not a description of an unpublished Old Navy measurement design. A smaller business can test a creator’s audience fit and a clear product destination without copying the celebrity scale.
How to read the result responsibly
A useful report keeps exposure, visits, orders and profit on separate lines. If only traffic and media delivery have been disclosed, say so. Do not rename a category-traffic increase as a company-wide sales increase, and do not treat impressions as people.
Editorial update, 10 November 2026: added the metric table and evidence limits; removed broad financial context that could be mistaken for the campaign’s outcome. The original publication date is retained.